
The Physiological Continuum
From all stood still to ride like the wind
Dr Coggan's Continuum
If you've used one of our "infamous" performance programmes or manuals, you'll be familiar with the basics of the Physiological Continuum. If not, then not to worry, we'll cover it here. Hopefully in enough depth for you to get a decent grasp of what happens to your body, when and why; but not going too deep as to be all sciency, geeky and dull. Bazinga!
I'm afraid, through necessity, this is a long factsheet. I'm not a clever enough wordsmith to edit it in to anything shorter. But stick with it, because even though I say so myself, this is one of my better ones!
 Myth Buster Alert!
Now we've busted a few myths in the past, especially with Lactate,
so here's our "Starter for Ten".
There is no lactate, aerobic, anaerobic, ventilatory or power threshold!
You will find the term "threshold" has been used out of context to such an extent that it now has an "understanding", even though that understanding is flawed.
Although it has become an ubiquitous term, it doesn't make it right, or means that it exists! Unfortunately, we have to use it, so you will find it mentioned here. But there isn't one...
The other reason for this factsheet is that there are many, many cycling related power and effort-based terms that coaches, cyclists, websites, magazines and all your local club-run experts bandy about, often interchangeably, without fully understanding their meaning or context.
Often people are talking about the same thing but using different terms; or talking about different things but using the same term. It's very, very confusing. We'll do our best to sort the wheat from the chaff, without adding further confusion.
All Stood Still...
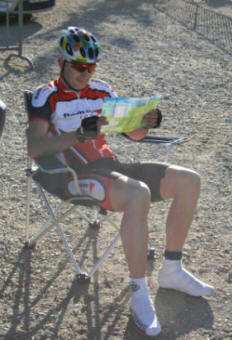
An Ultravox classic, and the start of our (long) journey. Even when
you are sitting doing nothing, like reading this or studying a route map, you are consuming energy.
Your metabolism is whirring away, deep inside, keeping your vital (and not so vital) organs working and ready for action.
One thing you can take for granted, is that when "at rest", your energy production is almost totally aerobic, but not quite.
In small quantities, glycogen is being consumed, fat is being burned and lactate is being produced. With oxygen in abundance, at this point, everything is under control.
At rest, you're probably generating around 1 millimol of lactate, whatever it is for you, (1.0, 1.25, 1.5) this is your baseline. We're all different, so there is no "magic" one size fits all number.
Once we start moving, especially on our bike, it's a whole new world of physiological discovery and adventure. Which we'll now go on together.
Okay! That's the pre-amble out of the way; to business...
The Physiological Continuum
The "continuum" is a conceptual representation of used energy
systems, adaptations and physiological responses to training and
racing.
It covers the whole spectrum of our
physiological exercise from slow speed Active Recovery, to
flat out Neuro-Muscular, lung-busting, sprints.
It's a constantly escalating scale of effort from "smelling the flowers" to warp factor Cavendish; riding your bike at walking pace, to sprinting until your eyes bleed. Picture these physiological extremes in your mind, because it's important to understand where we are going.
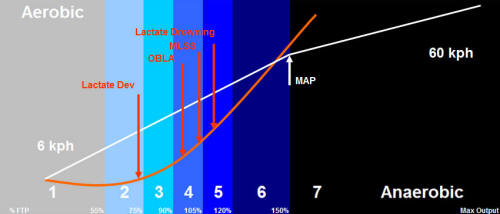
The journey route starts in the lower left corner of the continuum and is indicated by the trajectory of the white line in our collective of diagrams; finishing at our highest possible velocity, in the top right.
Sprinting: getting aero helps...
As our speed increases, and the white line rises, we traverse the continuum moving from left to right across the ever darkening blue bars. On this "journey", loads of weird and wonderful things happen to our bodies, our minds and our internal systems.
But first we need to understand the physiological sectors; what they are, what they mean and why they are important to you.
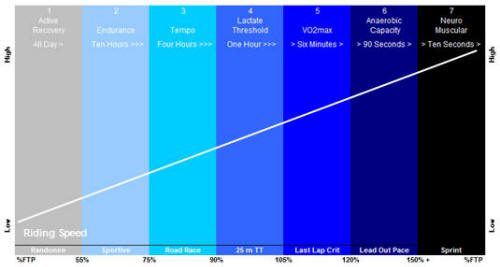
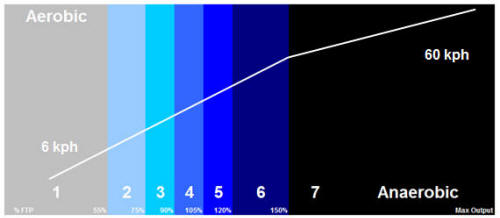
For clarity, the sectors are often shown as in the top diagram. They have the appearance of being distinct, linear, equidistant, uniform, columns. Unfortunately, they are not.
They are a dynamic, constantly changing, fitness spectrum; influenced by everything you do, or have done; or don't do or have not done.
As your cardio-vascular efficiency and effectiveness increases, the columns widen, and the dynamics around the white line angle and trajectory changes.
When you stop training, obviously the columns contract and the line angle decreases, but not across the board and not at a constant or consistent rate. But that's a factsheet for another day.
You alone, and your physiological genetic makeup, control the composition of your own, distinct, personal continuum. A good coach can help you get the best from your genetics and steer you in the right direction, but you are the one ultimately responsible for all your successes.
 Testing Testing...
The composition
and breadth of your zones are determined by
testing. If you've not been tested, you're guessing. This doesn't make it a bad thing.
But you'll be at a competitive disadvantage to an athlete that has
taken the "trouble" to get the "exact"
measured numbers.
Zones are determined as a percentage of one or more of your Heart Rate, Functional Threshold Power, VO2max (Maximal Aerobic Power) or for some, Lactate.
It all depends on the protocols used by your coach, or the resources available to you. Here we'll just cover functional threshold power to keep the concept simple and clutter free.
Remember, we're not trying to give you exact information as these things are very individual, we're just dealing with concepts; so this stuff applies even if you don't have any fancy gizmo's such as a power meter, heart monitor or even a simple speedo! If you ride a bike, this stuff matters.
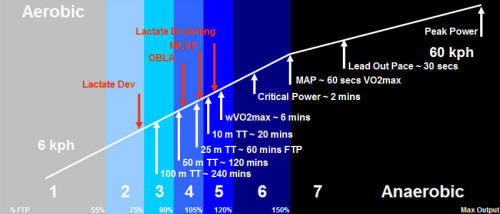
The Magnificent Seven Continuum Zones are defined as...
▼ 1 Active Recovery ~ > 55% FTP
▼ 2 Endurance Pace ~ > 75% FTP
▼ 3 Tempo Pace ~ > 90% FTP
▼ 4 Lactate Development ~ > 105% FTP
▼ 5 VO2max Development ~ > 120% FTP
▼ 6 Anaerobic Capacity ~ > 150% FTP
▼ 7 Neuro Muscular ~ 150% FTP +
1 ~ Active Recovery?
Active Recovery is the lowest form of exercise we take, although
it's not exercise as such because there should be no training effect
taking place. Active Recovery, as its name suggests, is used to
speed up the recovery process and allow training to take place
at a later time.
2 ~ Endurance Pace
Your typical steady-state club run pace, effort/fatigue sensation generally low.
Low concentration
required, regular breathing patterns, conversation possible, if not
encouraged. That way you can tell it's endurance pace!
3 ~ Tempo Pace
Through and off "chain-gang" pace, effort/fatigue sensation noticeable.
Concentration required to maintain effort, rhythmic breathing,
conversation stilted. Although most chain gangs are
batter-fests, they should be ridden at this pace to get the best
advantage from them.
4 ~ Lactate Development
At or around 25 mile (40 km) TT pace, effort/fatigue sensation
comfortably hard. High concentration, deep rhythmic breathing,
conversation almost impossible. Now we're training...
5 ~ VO2max Development
Effort sustainable for 3-7 minutes, strong effort/fatigue sensation
of hardly comfortable. Very high concentration, breathing at the ragged edge, conversation is
impossible.
6 ~ Anaerobic Capacity
Short 30 sec - 3 minute efforts, severe effort sensation. Extreme
concentration, high shallow breathing patterns, thinking not
possible.
7 ~ Neuro Muscular
Very short, very high intensity, effort sensation extreme but
short-lived. Little concentration, not aware of breathing, hurts
when you stop! Vision proves difficult.
It is extremely important to remember that the names of the zones refer to the physiological training adaptation that will accrue from riding in that zone.
It is not a descriptive term of physiologically where you are. Zone 5, VO2max, is not ridden at your VO2max, because your maximal oxygen usage is at the end of Zone 6, where your Maximal Aerobic Power is. Now you can see from where all the confusion comes.
These zones can be cross-referenced with heart rates if you prefer to use that method of tracking them.
Size is Everything
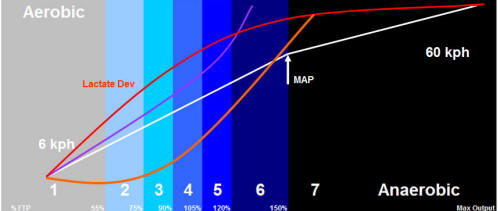
Here's how the continuum looks as a "proper" scaled, representation...
The continuum to scale, with our constantly rising speed profile
As you can see, this changes things a little, and not in a good way. Now you can clearly see the narrowness of the "lactate window (4)" and the other "important" power bands that follow.
The white line is the representation of speed; increasing as you move through the zones. I've chosen a linear model for clarity, although in reality it's curvilinear. A little "S" shaped.
For our "real world" weekend warrior, we start at around 6 kph rolling forward, and peak out at around the 60 kph dash for the cash.
Threshold Busted
From this chart, you can see that energy production, to
propel the bicycle forward, is always a
combination of aerobic (with oxygen) and anaerobic (without oxygen) energy.
Remember aerobic is generally (but not exclusively) fat fuelled and anaerobic is generally (but not exclusively) glycogen fuelled.
Zone 1 isn't fully aerobic, and Zone 7 isn't totally anaerobic. All zones are a combination of energy production systems. So, if that's the case, there can be no aerobic, or anaerobic, "threshold". Everything is a combo-mix.
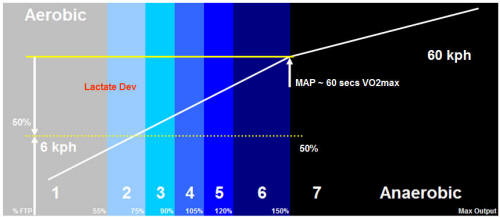
There is obviously a point on the way to Maximal Aerobic Power where one system is used more than the other, and it might be fair to assume this is at the 50 ~ 50 mark. But it's not. There is no aerobic/anaerobic threshold at 51% of your Maximal Aerobic Power. Because our bodies don't work that way.
Speed is about the only "stable given" on this model. Everything else is variable and anything but predictable.

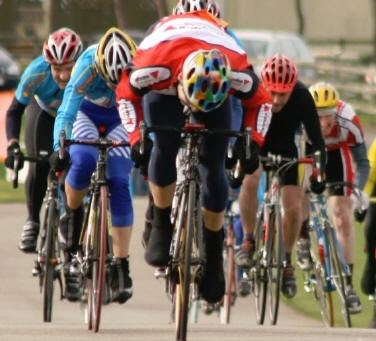
Taking people to their wVO2max to "snap the elastic"
Sable sur Sarthe ~ Le Mans
The Outcomes
There are many "transitions" you need to be aware of, as a lot
happens very quickly, and for a short space of time, when powering a velocipede
across your continent of choice.
As mentioned above, to get an accurate picture of what's happening we need to test ourselves to find at least one of the following; Max Heart Rate, Functional Threshold Power, VO2max (MAP) or Lactate Profile.
Even if you don't test yourself, the same stuff still happens to you. You just won't have physiological numbers to validate your training advances and objectives. All the information here is still relevant to you; please don't think it doesn't matter.
You can carry out a self-test by timing yourself on your favourite climb, or checking your Strava segments. You don't need sexy gizmos!
Reference Power Point ~ FTP
 Functional Threshold Power, is just the sustained power you can
reliably bang out for 60 minutes.
It's nothing more than a reference number. A bl**dy good one,
but it's not voodoo! There's nothing to be scared of.
Functional Threshold Power, is just the sustained power you can
reliably bang out for 60 minutes.
It's nothing more than a reference number. A bl**dy good one,
but it's not voodoo! There's nothing to be scared of.
It's as good as your 25 mile TT wattage and occurs at the top end of your Lactate Development Zone; Zone 4.
It has now become the benchmark against which all other power measurements are taken. But it's not a threshold, nothing significantly bad happens if you cross it.
If your FTP is 300 watts, there is no difference between riding at 299 watts or 301 watts. A significant marker it is, a threshold it ain't. Having said that, once you go too far past it, you enter a world of significant diminishing returns.
A key objective as an endurance cyclist, which effectively is anything that takes place on the road or in a field, is to maximise your FTP. The reasons for this are many and too complicated to go in to here, as there's loads of info elsewhere on the site.
Basically, we all need a consistent and easily
identifiable reference point from which to draw a
physiological baseline,
so please just accept that Functional Threshold
Power is it.
FTP can be measured or calculated. For now we'll go with FTP being 100% of your measured 60 minute Normalised Power, or calculated to be around 75% of your Maximal Aerobic Power or 95% of your 20 minute power output. There's three methods, so there's no reason not to be able to find it, or its heart rate equivalent.
Maximal Aerobic Power ~ MAP
Maximal Aerobic Power is found through undertaking a
Ramp Test. Maximal Aerobic
Power is,
unsurprisingly, the most power you can produce aerobically.
Which is obviously, with oxygen.
In these tests you ride against a steadily increasing effort until you can go no more. Your final sixty second power output is your MAP. Effectively, MAP is a genetic gift from your parents and is not easily improved. It is what it is. It's how much of that MAP you can make best use of which should concern you. As our strap line says, it's all about "realizing potential".
MAP isn't the same as peak power! Here's where another confusion often arises. My MAP is 388 watts but my peak power (the power put out in a full-on sprint) is around 1075 watts, although I did once hit the dizzying heights of 1118 watts! Well it made me dizzy.
Sprint Training with Mike Devlin ~ 29th August 2013
Even with three, 1000+ watt sprints, he battered me...
Maximal Aerobic Power is a product of your cardio-vascular system; the physiological combination of your heart, lungs, and oxygen uptake. Peak Power is a product of your neuro-muscular system; effectively how hard and how fast your big muscles contract. Peak power doesn't need oxygen to be present; to prove it, go lift a big weight.
Peak power has no relevance to anything, it can't be used to extrapolate information elsewhere. MAP can, but (as with all power figures) it only has relevance when placed in context. And that context is weight.
 So when you see power figures (of any sort) being bandied about
on forums, or amongst riders, of 300 watt FTP, 400 watt MAP, 340
watt wVO2max, 1100 watt Peak, etc, your first question is... "What weight
is the athlete?"
So when you see power figures (of any sort) being bandied about
on forums, or amongst riders, of 300 watt FTP, 400 watt MAP, 340
watt wVO2max, 1100 watt Peak, etc, your first question is... "What weight
is the athlete?"
Then, to get a full picture, the supplementary questions are "age and gender".
A 300 watt FTP is always regarded as an impressive number. But a 250 watt FTP for a 60 kilo rider (4.1 w/kg), is a little more impressive than 300 watts for a 75 kilo rider (4 w/kg). So always get context before forming an opinion. Me? I weigh 70 kilos and I'm 53 years old.
We also use wVO2max as a training parameter, which isn't the same as VO2max! We'll also cover this later. Again, another power confusion alley in which to get lost.
Lactate Profile
Any physical effort used to drive your bicycle forward results in a "reaction" from the body. Sadly, it's not an equal and opposite reaction!
The reaction is normally measured through speed, perceived effort, power, heart rate or lactate production.
Although we have a broadly linear speed line, none of the other factors will react in a linear manner. Least of all, lactate production. Again, there's loads of info elsewhere on the vagaries of lactate.
You just need to be aware that it's important for you to understand the concept of what lactate is and how it can (seriously) affect your performance if you fail to heed the signs your body is giving you.
Your primary objective (another one!) as an athlete, is to minimise lactate production, or maximise your tolerance of it!
Roy Booty
season preparation starts with a test...
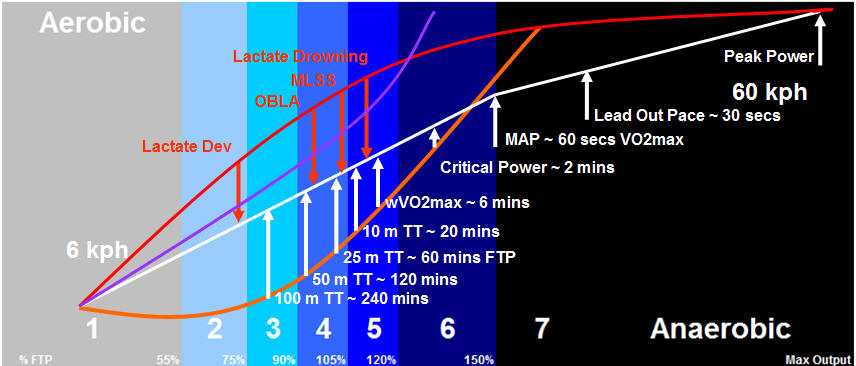
Test Results ~ Now it's Personal
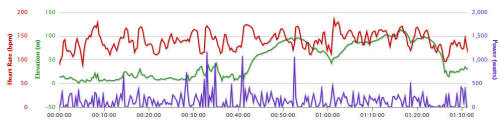
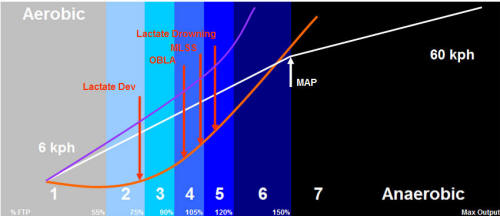
And here we have our testing result profiles. As you can
see we have a linear white line representing velocity, and every other line is anything
but, one of them even goes down for a bit!
Now it all starts getting very interesting very quickly. Hopefully, I'll now try to make some sense of the dynamic physiological inter-relationships that affect our performance and results.
The continuum with an overlaid rider test profile
▼ Orange Line ~ Lactate Production
▼ Purple Line ~ Power Output
▼ Red Line~ Heart Rate
What Now?
The above chart, shows the trajectories and relationships of our
various physiological responses to the stresses of making our bike
go faster.
Now we have benchlines (my made up portmanteau) against which we can track future progress.
Okay, we are all different, and we will all have slightly different curves. And we all sit on these slightly different curves at slightly different points. But the conceptual relationship is good enough for us to form opinions as to where our performance markers should be and how they affect us.
Your FTP might be 76% of your MAP, mine might be 73%. The point is to know it exists and where it might be. No one is going to be at 40%, or at 95%, and no one has a heart rate that goes down when they go faster.
These graphs are representative of what is happening to us when we push ourselves to our limits. So let's ride our bike and see what happens...
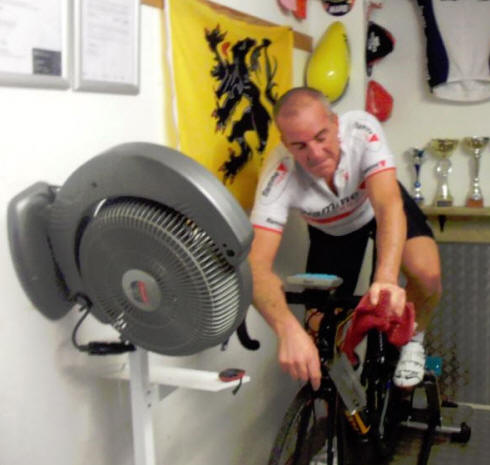
Road To Nowhere
 We're
sitting on our bike, ready to go, on the straightest road in
the world, with no hills, no wind, no junctions and no cars.
Or as I call it, my turbo.
We're
sitting on our bike, ready to go, on the straightest road in
the world, with no hills, no wind, no junctions and no cars.
Or as I call it, my turbo.
Over the course of our exploration we're going to ride gently, from 6 kph and slowly build to 60 kph.
After a fifteen minute strictly level 1 warm up, smelling the flowers to oxygenate our blood, we're ready to progress.
 Supercalifragilistic~LACTATE~alidocious
At rest you have around 1 millimol of lactate in your blood.
Once you start moving, you produce lactate; the faster you go the
more you produce.
But your body can handle it, as long as there is enough excess oxygen left to metabolise it.
As we progress from 6 kph Zone One and move in to lower Zone Two, our body actually uses lactate as a fuel.
Lactate, although it is developing and is measurable in the blood, actually begins to drop as the abundance of oxygen mops it up and metabolises it (as fuel) quicker than it's being produced. This is a nice place to be. We're in harmony and for now, all is good. But we press on...
At the top of Zone Two, lactate begins to build again as our body makes more demands on our precious "multi-use", lactate buffering oxygen reserves.
The more oxygen demanded by the muscles to go faster, the less there is to "mop up" the excess, and increasing, lactate production. This Lactate Development "turning point" is often (incorrectly) referred to as the "lactate threshold".
A recognised physiological definition of the misnomer "threshold" is when blood lactate readings increase 1mmol above baseline. This happens a lot earlier in the physical spectrum than most people realise.
Heading towards Zone Three, we begin to reach an imbalance in the metabolism of lactate. Measurements in the blood start to move up at an increasingly accelerating rate but not to "dangerous" levels.
Zone Three is relatively benign; until we get to the upper end of it. But Zone 3 is important because it's the zone that sits between your two significant lactate markers. You should work to make Zone 3 as wide as possible, but it doesn't mean you spend hours, for weeks on end, riding here! We'll come back to this.
As we start to leave Zone Three our body is now using more oxygen to power the bike than is available to "mop up" the lactate and stabilise lactate concentrations. So are we approaching another "threshold"?
As we hit Zone Four, we approach the point where the misleading terms of aerobic threshold, anaerobic threshold, ventilatory threshold, or a second stab at defining (incorrectly) the lactic/lactate threshold, are often applied by well meaning cyclocrats.
But all it is, is the Onset of Blood Lactate Accumulation. At this point there is a shift from predominantly aerobic to predominantly anaerobic energy production.
From this point onwards, a slight increase in speed will produce a slight increase in lactate production (which is okay) and a slight drop in available oxygen to metabolise it (which is not). We are now heading towards the perfect storm for a significant increase in blood lactate concentrations.
Power output now needs very careful management to prevent us falling in to the area where things go from "not so good" to bad. But all is not lost.
We are still, just, in control; breathing deep and rhythmically, but in control. We can push deeper in to Zone Four, but our ability to sustainably process and clear lactate is now rapidly diminishing.
As we approach the top end of Zone Four (FTP), our breathing becomes heavy, bordering on ragged. Lactate is now "just" in balance and the tipping point can be as little as one rpm of cadence away. At these levels and speeds, just one rpm can equate to 20 to 35 watts.
This is our Maximum Lactate Steady State (MLSS) speed/power/heart-rate. MLSS is the highest point at which lactate production is matched by sustained lactate clearance. A very, very narrow window.
If we stray past this point, very quickly it's game over. Lactate will rise exponentially for any given speed or power increase and heart rate will actually flatten off as oxygen consumption maxes out.
If you want to break the hour, you need to stay in Zone Four. If you want to climb a mountain quickly, you need to stay in Zone Four. If you're on a breakaway, a chase, or doing a 10 mile TT, you can dip your toe in to the murky waters of Zone Five. But you won't be there for long.
 We are about to enter the "Tunnel
of Darkness" that is Lactate Drowning.
We are about to enter the "Tunnel
of Darkness" that is Lactate Drowning.
Another of my sayings, is that "for every ten seconds you're in the tunnel, it'll be a minute before you can restore the balance and return to the light". And that's on a good day!
The darkening colour choices on the continuum are not there by accident or coincidence.
No matter what your cycling discipline, Zone 5 is by far the most important physiological marker you should measure and track.
Who cares what your max heart rate is, no one ever won a race because they had the highest heart rate. Trust me, I know from experience!
If you're brave, or exceptionally gifted, you can go up to the line of Lactate Drowning and peer in to the tunnel entrance. But go past it, and you'll be entering the land of pain where the man with a hammer lives. It's only a matter of time before he finds you.
Power Trajectory
 Power and heart
rate responses act completely differently to that of the lactate
response. So, for the sake of completeness we'll cover them
quickly.
Power and heart
rate responses act completely differently to that of the lactate
response. So, for the sake of completeness we'll cover them
quickly.
Power and heart responses start off similar, to a point, but they then dramatically diverge.
The (purple) power curve, at first is relatively benign and follows the speed curve, gently rising a little quicker but parallel to it.
Then strange things start to happen.
There are a million other factors that come in to it, but for the sake of brevity; the power curve, goes up "quicker" than the speed curve until it gets to about 25 mph (40 kph) then it goes up like a rocket.
Basically, power output cubes, to the square of speed.
Once you get past a certain speed, air resistance becomes the biggest factor in slowing you down. Overcoming air resistance requires a substantial and dis-proportionate increase in power. This is the main "unknown" reason many riders can't beat the hour for a 25 mile time trial.
Power and speed are directly, but not linearly, linked. To go from 20 mph to 22 mph, requires a 10% increase in speed. Yet to accomplish it, a 75 kilo rider would have to produce 23.4% more power.
To go from 20 mph, to 25 mph, a 25% increase in speed, requires a 45% increase in power. Now you can see the "unseen" issues we face.
And to go from just under the hour and 24 mph, to the magic 25 mph, a 4% increase in speed, requires double the expected increase in top end cruising power. This one mph increase, which may just be two rpm extra cadence, requires a whopping 9.26% rise in average power output; that has to be held for a full hour!
Heart Trajectory
 As
you know, I'm not a great exponent of training by heart rate.
Those that have been with us for the last ten years will know that I
have a resting heart rate of around 48-50 bpm and a max of around
234 bpm. Pick any hill you want, stick me on it, and I'll show
you a 200 + heart rate.
As
you know, I'm not a great exponent of training by heart rate.
Those that have been with us for the last ten years will know that I
have a resting heart rate of around 48-50 bpm and a max of around
234 bpm. Pick any hill you want, stick me on it, and I'll show
you a 200 + heart rate.
For the last twenty-five years I've always worn a heart monitor, as much out of habit, and to amuse my friends, than anything else. Our heart rate curves will be the same shape. But our numbers will be radically different.
Your heart is an indicator of the effort done, not the effort you are doing. On all our tests, I'm at pains to point out to clients that there is a thirty second delay between what you're doing now and the response from your heart. You need to bear this in mind, when traversing these zones.
To see for yourself, take another look at the sprinting profile. Notice how the (red) heart peaks, after the sprint has finished, or lags at least 30 seconds behind the (purple) power output on the (green) hills...
If you go through any of these zones in under 30 seconds then you're compromising your ability to successfully pace your effort. Sooner or later, you will reap the consequences. And not in a nice way. This can often be seen at the start (or turn point) of time trials or the instigation of an attempted break or chase.
When we do our chain-gang speed work, most of my time is spent screaming "Gently!" as riders come through at 30 mph plus. Most come through way too fast, almost sprinting to (and off) the front. Whatever you do, do it gently, don't shock your system into an over-reaction.
You can now clearly see the "heart rate turning point" (Zone 5) as you approach your wVO2max wattage, and heart rate flattening (Zone 6), once you approach your Maximal Aerobic Power. You can also see the inverse relationship between rising lactate production and the reduced increase of heart rate.
wVo2max is the power required to elicit an increase in Maximal Aerobic Power. You can't just keep riding at MAP and expect it to increase. The physical cost for doing so is enormous and you'll probably burn out before realising any significant performance gains. But you can ride wVO2max intervals to nudge up the ceiling or make yourself more efficient lower down the scale, where it really matters.
With the information we now have, we are able to build a physiological picture of how our body works when we put it under pressure. This is super-important stuff and crucial to your understanding of how to progress as an athlete.
Bringing it Together
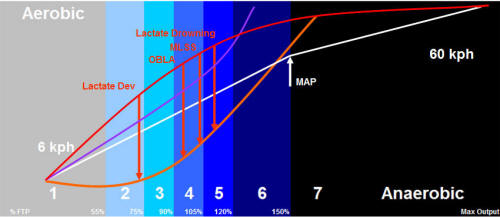
Now we can begin to layer endurance capabilities, and race level
efforts, on to the charts physiological "stress points" and make it
relevant to you and your real world riding.
Here we have significant event and power markers with their relevant time duration. I've left the lactate markers in place so you can map their relationships with speed and time.
You will see, for the first time, the introduction of Critical Power to our chart and our factsheet. We've not mentioned it before, but it is a significant marker in the outcome of our success. And here's why...
Critical Power is your "crash and burn" wattage. This is the point, beyond which you must never stray. Bad things happen very quickly, irredeemably and catastrophically when you pass this point. We'll cover Critical Power in another factsheet. But for now we'll look at some facts and numbers.
The Critical Facts...
Between 100 mile pace and 25 mile pace, there is a wattage spread of 15% over a 180 minute time window.
Between 25 mile pace and 10 mile pace, there is a wattage spread of 5% over a 40 minute time window.
Between 10 mile pace and wVO2max pace, there is a wattage spread of 5% over a 14 minute time window.
You can clearly see the rapidly closing, windows of opportunity.
Between all these significant markers, there could well be an average speed difference of just...
3 mph between a 100 mile effort and a 25 mile effort
2 mph between a 25 mile effort and a 10 mile effort
1 mph between a 10 mile effort and a wVO2max effort
To a "normal" person, the numbers just don't stack up. But we're cyclists, we know the disproportionate price we pay for increased speed.
Now we come to an anomaly! The difference between your wVO2max six minute pace and your Critical Power two minute pace, is quite large. Because once we get up here we're using different energy systems that play by different rules. We're now predominantly anaerobic.
Neuro muscular power comes in to play and you can bang out big power and big speed, but not for very long. As we've seen, we can easily bang out over a 1000 watts at peak power, but just for ten seconds.
Critical Power is a combination of these energy systems and plays by different rules. But when it's gone, it's gone. Everything stops. So whatever you do, stay out of Zone 6, especially when starting a time trial!
The only time you dive up here is to close a race winning break, start a race winning break, or begin a final kilometre lead out. Those of you that have tried the Cancellara's or Sprintervals will totally understand how much these efforts take out of you.
The Big Picture
Here we are, bringing it all together, with all the profiles,
physiological markers and time-scaled power outputs.
Click the chart above to see an enlarged view
We can clearly identify the points at which we reach increased lactate production, the flattening of the heart rate and the exponential increase in power which gives us a diminishing return for our efforts.
One aspect to be aware of, during your breakaway or chase effort, is that cardiac drift, and VO2 consumption will stabilize if intensity is kept below critical power. That's why it's called "critical". Don't confuse this with Friel's CP Critical Power ~ that's something that was coined much later and is an entirely different entity.
To maximise our potential and increase our performance as an athlete we need to look for marginal gains (we've all been doing it for a 100 years) in areas that give the most return for the least cost.
 Free
Power
Free
Power
You can easily move your power curve down and to the right,
making yourself more efficient and effective, just by riding in the
drops.
I see loads of riders going out the back of races and training rides, on the hoods. They're trying really hard, but struggling to hold a wheel and stay in the pack. Eventually the elastic snaps.
Get in the drops, lower your shoulders, get aero. You will go one kph quicker for the same power output, or save 25 watts of expenditure, just by adjusting your body position.
It's there for free. Imagine that, extrapolated over a four hour ride!
Riding like this also allows you to push back other restrictors. The longer you can hold a high speed, and challenge the cardio system, the more efficient it will become. Everything becomes easier.
The Dead Zone
Stay out of the "dead zone". Our
Gunsite Grupetto
flamme rouge
training rides are very different to your usual club-runs or
chain-gangs. Everyone leaves their ego at home and everyone
works for the collective good. It's a great place to be.
Our super-intense programmes have mid-week riding for yourself and weekend riding for others. But that doesn't mean you don't suffer.
 Most
club rides have evolved in to steady-state Zone 3 rides that slowly
drift up to Zone 4 towards the end and may finish with a flourish as
the cafe stop approaches.
Most
club rides have evolved in to steady-state Zone 3 rides that slowly
drift up to Zone 4 towards the end and may finish with a flourish as
the cafe stop approaches.
The flamme rouge rides are either Zone Two, where we ride to our marker, then it goes to upper Zone 5, 6 or 7. At the end of the marker (Strava Segment) we drop back to Zone 1, collect everyone, then cruise at Zone 2 until we reach the next marker. It's full gas for full recovery.
There is no dead zone riding. What's the point? Nothing happens there from a physiological or event perspective. Look after the extremes and the middle will look after itself.
Obviously this isn't a year round process! We're not full gas in October when we're smelling the flowers, but we do put "kicks in" every now and again to fire the metabolism.
We are after all racers, so lets race!
Stress The Systems
To improve as a rider you have to keep nudging at your physiological
boundaries until they bend out of shape but don't break. Let
them recover, adapt, then bend them again. This can be done on
a micro level, as in interval training and the
Grupetto rides, or a macro level,
over the course of a month or so as in our
FTP & VO2max training programmes.
If you're not stressing the system and pushing it up, gravity will pull it down. But there's no use having a peak power of 2000 watts if your FTP is 180! Stress the systems that need to be stressed to ensure you maximise your potential and get the best out of yourself and your rides.
Okay, I've gone on enough now, time to stop...
Do the right things in the right order at the
right time, expect the right results
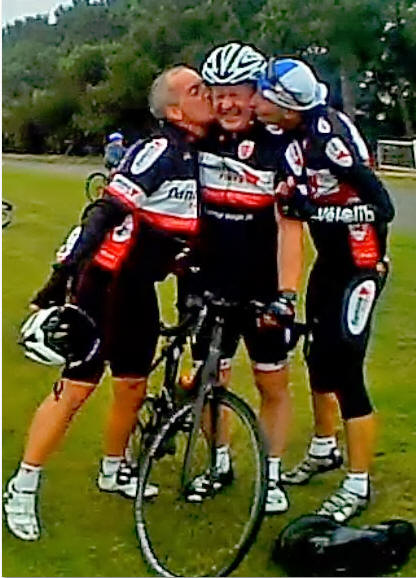
Mark Lamy, centre taking the
win
The podium girls went AWOL so Roy and myself stood in...
The Message
The soundbite of the day is ~ If what you are doing isn't
directly contributing towards your clearly defined goal, stop doing it!
Knowing this stuff is more important than being tested, having a power meter, the latest Di2, carbon valve caps, or aero road helmets.
Having the numbers is good, but not a deal breaker, Merckx and Hinault never had all this stuff at their fingertips. They made the best of their genetic gifts by understanding how hard they could push for how long.
Now you have the same information as them, it's up to you how you use it to progress your cycling, results and enjoyment. Because the pain of riding at 300 watts is a lot more tolerable when your dishing it out than when it's being dished out to you.
Depending on the rider mass and conditions, in a 53 x 13, a tiny increase of just 1 pedal rev (less than 1%) will bring speed up 1 kph (around 2.5%) which requires a sustained power surge of over 20 watts, or a huge 7%!
The margins for error when traversing the continuum are tiny. The price to pay for making an error are huge, will come quickly and in most events are irrecoverable. But the rewards for getting it right are priceless.
The difference between the racer you are and the racer you want to be is determined by how much you are prepared to suffer in training.
Find your limits in training, push them back gently, gradually and sustainably. Then make sure you stay away form them in the races. Unless of course, you've just passed under the flamme rouge.
So suffer well my friends suffer well...