Training Stress ~ Fitness v Rest
The information in this factsheet is complementary to the pearls of wisdom held in the Intensity v Volume factsheet. You may wish to review it before or after this essay, to familiarise yourself with the trilogy of pain, power and success.
This graphic depicts the "Darwin model" of man's adaptation to his world over time. Luckily for you, as a cyclist, we adapt to our training in much shorter timescales than those above, and possibly a lot shorter than you'd actually believe.
The Preamble...
Previously, we've discussed making best use of the genetics
gifted to you by your parents. We are however, more than the sum
of our genes. We are all different and all special; some of us
just take longer to find what we're good at than others.
To become a better cyclist we need to move from the position we now hold, to that of one stronger.
In my opinion (here he goes again!), we do that by:
▼ taking a performance evaluation
▼ deriving a baseline from our results
▼ with baseline led duration, intensity and frequency
▼ carrying out a period of structured, targeted training
▼ then after a suitable period of time...
▼ re-evaluating our performance to...
▼ measure the fruits of our labour
Once again, I will use power training examples to make the case for my propositions to you, as they are very easy to follow, quantify and substantiate. It allows us to deal in facts, not opinions or hearsay.
If you haven't got a Power Meter it doesn't really matter. The core principles are the same. At the end of this article I'll show you how to evaluate your training without having all the gizmos.
It's so simple, it's almost harder to get it wrong than right. So why isn't everyone winning?
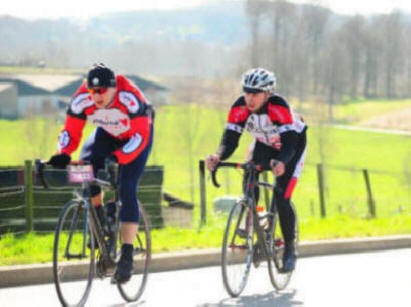
For every action there is a reaction
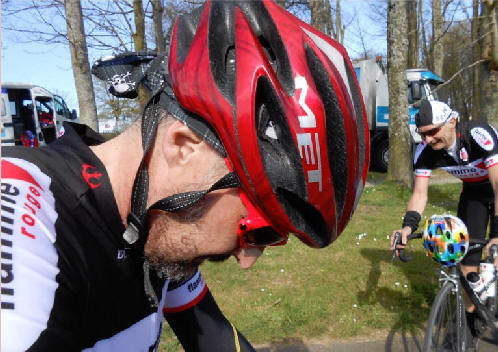
Obviously Mick pushed himself harder than I did...
Tro Bro Leon 2014
Things you
all ready know...
Remember school, and Newton's third law of motion?
For every action there is an equal and opposite reaction. Tuck
this little nugget somewhere safe because we'll come back to it later...
Training is a combination of effort and recovery. Just as the effort has to be at the right intensity, so does the recovery. Intense Recovery may seem an oxymoron, but we have to pay as much attention to our recovery as we do our training. Not everyone does.
So how do you ensure you hit the right numbers and maintain constant, sustainable, measurable progression? As you'll see from other supporting factsheets in this thread; each training session you undertake elicits a training stress on the body. To be of value, we need to measure or define that stress and make use of the information it gives.
To recap; a one hour ride at your Functional Threshold Power gives a Training Stress Score of 100 at an Intensity Factor of 1.0. For most of you this will be your typical 25 mile Time Trial. For me it'll be my best hour of screaming across the roads of Flanders next week. I don't do time trials, there's no one to talk to!
So, now we all have a benchmark against which we can compare all our rides. My best, your best, their best, current 60 minute effort equals 100 TSS and 1.0 IF. It doesn't matter if you're my mum or Jens Voigt, their best current 60 minutes will give them the exact same relative training stress and intensity factor. 100 and 1.0.
Current, is an important word; something else we will come back to later.
Training
Stress Score
 Here's
a quick recap of how it works.
Here's
a quick recap of how it works.
This 2 hour, 42k recovery ride had a Training Stress Score of just 55.5 and an Intensity Factor of 0.531.
This session stressed me half as much as a 25 mile TT but it was spread over two hours so it was a quarter of the actual effort per hour.
A perfect recovery session, no training stimulus whatsoever! A TSS of 22.5 per hour. It's like taking your bike for a walk.
 This
is last year's Bernard
Hinault Sportive. 5 hours 40, 176k at 31 kph, and it was
hilly with 2600 metres of climbing. Giving a TSS of 400, 0.84
IF.
This
is last year's Bernard
Hinault Sportive. 5 hours 40, 176k at 31 kph, and it was
hilly with 2600 metres of climbing. Giving a TSS of 400, 0.84
IF.
With 3600 kJ (calories) of work undertaken it was a bit of a bugger. The equivalent of riding four back to back 25 mile TT's at 84% of intensity. This ride gave a TSS of around 71 per hour.
A significant fitness contribution.
So now you begin to get the picture of how the TSS works and how it can help make sense of our training load. But what about Intensity Factor IF?
Intensity Factor
The intensity of your ride is defined as a ratio between two
power measurements. The first measurement is your Functional
Threshold Power (FTP); as we all know this is the sustained power you can dish
out for an hour. There's loads of ways of finding it, you can
review them here...
The second measurement is Normalised Power (NP). Average Power isn't a good measurement to use because it has lots of freewheeling, down hills, and hence, zero wattage in it.
Normalised Power is a complicated algorithm that takes measurements over a rolling 30 seconds and returns a quantifier that gives a close approximation of the power you could have sustained if you had rode the relevant time period at a constant level.
You'll see that my average power for the Bernhard Hinault was 176 watts but the normalised power is 218 watts.
If I'd ridden at 218 watts for the entire 176k, uphill, flat and down hill, I'd have finished in exactly the same time.
If I'd ridden at 176 watts, Dianne would have beat me!
▼ Intensity Factor = FTP/NP
We now have a set of consistent and replicable metrics against which all our training sessions, races and recovery rides can be compared. Which is great, but how does it help us in real life?
Bringing it Together
We can now track all our on bike activity over time, to give
us a series of fitness indicators. We can track the workload we've
undertaken in the short term and the workload we've placed on our body
over an extended period of time.
With this information we can gauge our level of fitness progression. We can also interrelate that work with our rest and recovery to see how fresh we are.
Here's some more in-depth info, so sit up and take notice as it may take a while to make sense. I've tried to make it as clear as I can but I'm afraid my writing skills aren't fully up to the task.
Acute Training Load
Here's one of my very recently completed (last week of Feb) green weeks; which
is week one of my three on (Green, Amber, Red), one off (Grey) training
pattern. In this week I did four training sessions.
I train on Tuesday and Thursday on the turbo, and do road rides on Saturday and Sunday. In Training Peaks, I download all the SRM data and it does all the hard work for me to give me a nice graph of my Acute Training Load (ATL) for a rolling week; which is the pink stuff below.
The turbo sessions are short but intense and give TSS's of around 70 to 75 points. As you can see from the IF results, they are ridden above threshold because even with the rest periods and warm up, cool down, they still come out around IF 1.
I've cut back the duration of the road rides as I build up to the season start. But they're around 100 - 120k, all in the big ring, which gives mid 250 to low 300 TSS points.
Remember, the Bernard Hinault in June was a 400 TSS ride.
On a graph ATL scores look like this. The week above is the third peak from the right.
ATL, takes your rolling seven day training stress score, adds it all up and divides by seven. So you get a training stress of so much per day. This takes in to account your rest days, missed days and recovery rides. If you take the green boxes above, you get 71+75+282+255= 683. Divide by 7 and you get; 97 TSS/d. So I rode the training equivalent of a 25 mile TT per day for a week.
You can see above that my first recorded week of the training year brought a training intensity of 21 TSS/d, on the 1st November. The equivalent of less than a 25 mile TT per week.
My winter sessions built up to a significant peak of 152 TSS/d by Valentines day. It was just a quick snog this year, I was too tired for anything else as I'd ridden the equivalent of one and a half 25 mile TT's per day for a week!
Hopefully I've explained it well enough that it now begins to make sense. ATL is your Acute Training Load because it measures in near time; it's what you're doing now. ATL is your weekly feedback on how much training stress you've placed on your body.
Chronic Training Load
Don't fall in to the trap of thinking "chronic" means sick.
Chronic, relates to chronological. it's time, a period of time.
In
this instance it's a period of time that covers 42 days. It can be
manipulated, but it's best to just accept that 42 days is a good number
over which to track your fitness.
After 21 days your body begins to adapt to the training loads placed upon it. These adaptations will hang around for another 21 days or so. Hence, the rolling 42 day, Chronic Training Load, measurement period. Something's we just have to accept as a given. This is one of them.
Obviously the training you've done this week will have a bigger impact on your fitness than the training you did 42 days ago. But that training will still have made a contribution. If it didn't, why would we spend all winter training?
CTL is the acronym, for Chronic Training Load. CTL is the accumulated measurement of a rolling 42 day training load. Our objective is to make sure it continually, steadily, and gently rises.
As we stated above, older training has less, but still some, contribution to make towards your current fitness. Highly devious and complicated algorithms do all the work for us and present us with a nice graph, like the one I've suffered to produce below...
You'll see that I started from a CTL low of 40 TSS/d on 1st November, which is higher than my ATL of 21.6, because I had big sportives and heavy training rides from the previous season (within the 42 day window) contributing towards my CTL. So I went in to this year carrying residual fitness from last season. A good start!
Each week I manipulated my training intensity and volume to keep a steadily rising Chronic Training Load. Using the same methods as for the ATL, only spread over 42 days instead of 7, and with the earlier sessions making less of a contribution than the latter, the training stress scores are calculated and displayed.
We have to train a little bit harder each week, increasing either volume or intensity, and in some cases both, to ensure we get fitter, faster, stronger as the season approaches.
This year at flamme rouge we've changed our winter training regime. It was time to try something different. During the whole of last season I never recorded a CTL higher than 75 TSS/d. This year I enter the season fitter than I ever was last year.
It's nice to see the theoretical plans on paper in September, transformed in to real life personal high, sustainable pre-season peak TSS scores in March. It's the same for all our riders. They've all screamed in to the new season.
Training Stress Balance
Okay, for those that have been paying attention (I know it's
hardly edge of the seat stuff and a little sciency, but stick with it)
we now come back to Newton and his third law.
For every action there is an equal and opposite reaction. We can use this to demonstrate how training works.
You train (an action), you get tired (a reaction).
The harder you train, the higher the action; the more tired you get, the deeper the reaction. I'm sure you're more than aware of, and constantly suffer from, the concept.
Now we throw in Darwin for good measure. We train, we get tired, we rest, we adapt.
We train again, we don't get as tired. We've adapted! We can now do one of two things. We can take shorter rests, or we can train harder.
By taking shorter rests and keeping the training stress the same, we won't get any stronger, we'll just increase our endurance. By increasing the stress, and keeping the rest the same, we get stronger but may compromise our endurance capabilities.
To reach our potential we need to mix and match the stress/recovery quotients. The skill is in finding your magic formula. Not mine, not his, not hers, yours. You are unique, make sure you follow a unique path.
To prove the point of how training affects you, there is a third training metric; the Training Stress Balance (TSB). TSB reflects your reaction to the CTL and ATL. As your stress goes up your freshness goes down. Training Stress Balance (TSB) is the physiological response to your training. Take a look at yet another of my many graphs...
The Blue Line is the CTL (Chronic Training Load) an exponentially weighted moving average with a 42 day time constant, which smooths it out slightly. It climbs slowly, through necessity.
The Pink Line is the ATL (Acute Training Load) an exponentially weighted moving average with a 7 day time constant and is quite spikey. You can just make out the three on ~ one off, training pattern.
The Yellow Bars represent TSB (Training Stress Balance) of which I'm now going to explain the relevance.
Training Stress Balance is a fancy name for Freshness! How rested you are, how recovered, how ready to go. High is obviously good, but not necessarily the best. My mum will have a super high freshness as she's now retired and potters around all day, but I doubt she could win a Crit!
You'll see that on November 1st, I was nice and rested at 12.9. The peak of a steadily climbing line as I recovered from the stresses of the previous season.
Then we started training, and you can see the gradual decline (dips in the yellow bars) of "freshness" over time, as my training became harder, longer and faster. The recovery periods became, through necessity to create the required adaptation, shorter. I began to eat away at my reserves of freshness.
What
does it all mean?
As you all now know, the training load came to a peak on
Valentine's Weekend. Two laps of the legendary flamme
rouge Classics Circuit and an hour
big ring to finish off. You can see the figures below. The
112/24.3 figure in the Workout column, is the distance/speed in
kilometres.
These two rides (classed as Cross Train to get the red shading in the colour code) were the training equivalent of a 100 mile TT on Saturday and a 80 mile TT on Sunday. You'll see that the Saturday ride was harder than the 176k, 2600 metres of climbing, Bernard Hinault Sportive used as an example above.
To squeeze every last drop of freshness out of us, we did it again on Sunday, but without the added hour. Train hard, race easy.
You can see the cumulative results of the final red week rides in the above three charts.
▼ ATL 151.9
▼ CTL 87.9 and a
▼ TSB of a jaw droppingly low, - 65
My work is done. And this isn't just me; we had loads of riders out this winter who all slowly but surely drove themselves right to the edge of fatigue. I truly believe that they are all going to win races, medals and achieve personal bests this year due to their unstinting commitment to their winter training. I can't wait to see how well they're going to perform as the season unfolds.
The Real
Clever Bit
With freshness at an all time low, it's time
to allow the body to recover, rebuild and realign.
You'll see that there is a significant drop after the highest pink spike, and that's the recovery week. At the end of that week I'd "recovered" to a TSB of -15.
There then followed three slightly, relatively decreasing weeks of effort (they were still full-on), more a consolidating plateau due to the drop in volume rather than holding back on intensity. These weeks held the blue CTL (my fitness) steady, while allowing the yellow TSB (my freshness) to climb.
Next week sees my first sportive of the season in Flanders, the E3 Prijs Vlaanderen, using technology such as this I know 100% that I'll be at my strongest and my freshest. It won't be left to chance, it won't be guessed, it won't be hoped for. It'll be a given.
According to the data, I'll have a CTL of 80 and a TSB of +25. I'm confident I'll be as well prepared as I can for the big day.
Planning your training, and more importantly, planning your recovery, with or without these tools will help you meet your goals and objectives for the forthcoming season. Don't race yourself to your objective and ultimate fitness then be too tired to capitalize on your efforts.
Recover your way to success. You heard it here first!
The truly clever bit is being able to predict when enough is enough. Pushing yourself hard enough to constantly adapt but not pushing yourself so hard that you break. Which begs the question; Where's the overtraining tipping point? The answer to that little season-saving conundrum will be revealed next month.
Full gas across the Flandrian plain...
The
Message
Fitness, comes from quality training. Freshness, comes from quality rest.
Form, comes when fitness and
rest are least compromised. Someone who is fully rested could
never win a race. Someone who is at full fitness could never win a
race.
People in "form" win races. Form is what you are trying to achieve, hold on to, and predict. You need to be in form for your key objectives. Form, as a cyclist, is your only objective. Hit peak form at the right time and your only concern should be, which side of the fireplace shall I put my trophy?
The rise of your CTL has to be "controlled". Taking it too high, or increasing it too rapidly can lead to overtraining. You control it by steadily increasing the training stress you place on your body to raise the TSS.
Each week you should monitor your ATL to ensure your body is adapting to the stresses previously placed on it. As TSS goes up the TSB goes down. Balancing the two is key to realizing your potential.
Graphs and charts and all these gizmo's aren't to everyone's taste. But for me they allow me to make best use of the very limited time I have to train. They help me far more than a new frame or a new set of wheels ever could. To me, buying a power meter is the best value for money return on training investment you can make.
Does this stuff work? Look at this...
Compare my dotted line Power Curve from 2004, when I started recording my power outputs on the road, to the yellow Power Curve from this winter's November to March training sessions.
All I need to work on as the season approaches is to iron out my dips at three to six minutes and seven to thirteen.
But as you can see, I've increased my power output (massively in the neuromuscular and anaerobic levels) across the board over the years, and this is despite aging ten years in the process.
Could I have done that by just doing more now of what I was doing then? I doubt it.
If you haven't got a power meter you can apply similar principles if you can be bothered to set up a spreadsheet to track your cumulative figures. Or just write it in a diary. However you do it, try it, it's worth the effort.
For every intense interval turbo session, you're looking at 70 TSS points per hour. For endurance turbo sessions you're looking at 60. Flat road rides, little ring, 50 TSS p/h, Club Runs 55 TSS. Heavy, big ring, hilly interval rides 80 TSS p/h. A 60 minute 25 mile TT, 100 TSS.
Or you could bite the bullet, buy a power meter and open yourself up to a whole new world of cycling!
Someone sent me this clip of a forum post from the Power Man himself Andrew Coggan. At least he liked it. I've also corrected my interpretation of his definitions. The whole idea of the site is to keep things simple and layman-like, but I'm not adverse to making changes to keep things factually correct.
Until next time...