The Power to Sprint
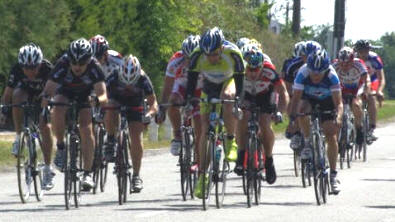
Like coiled springs with 250 metres to go...
Coeur de Bretagne ~ France
The idea behind structured training is to make best use of your training time by making it specific to your requirements and tackling your weaknesses.
To help identify your weaknesses you could undertake an Ability Gap Analysis (contact me for details).
Why a Wingate Test?
I recently had a chat with someone who saw themselves as a
time triallist, who was getting creamed in the finale of races and
bemoaned their lack of a sprint. "I'm just not a sprinter, I don't
have the power" was their explanation. When I asked "How much
sprint training have you done?" guess what their answer was.
I said I'd test them, do a four week plan, test them again and guarantee, (if they'd followed the plan), an improvement they'd be happy with or they didn't have to pay me. Here's the results.
Test Protocol
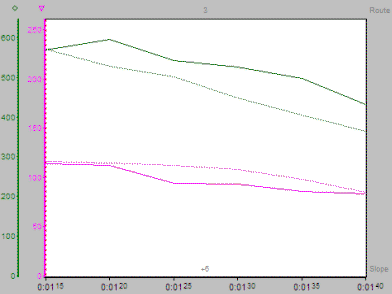
To explain the timing marks at the base of the graph you'll have to
understand the test protocol.
First, there is a long warm up which isn't on this graph. The program then begins with a one minute continuation of that warm up and a ten second countdown to the full effort. So the test proper begins at 0:01:10 which explains why the bottom, superscript timing marks are ten seconds ahead of the test duration.
The first five seconds are masked to allow a build to peak. So, 0:01:15 is actually 5 seconds into the test. The test lasts 30 seconds which is why it finishes at 0:01:40. Simple!
The Stats
You'll remember from the first test published
last month (the dotted line) that the peak effort occurred five seconds
in to the test. The green line is power, the magenta line is
cadence.
On the retest (the solid line) the peak effort isn't only
higher but it occurs at the ten second mark, five seconds later than the
first; already a significant power and time improvement.
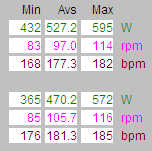
So we have peak power up from 572 watts to 595 watts; a 4% increase and for
double the initial sustained time period.
Peak power is good but it doesn't win
sprints, it just allows you to open up that initial gap. The fact
that we now have a ten second sustained burst rather than a five second
one gives us the initial psychological as well as physiological
advantage.
In the first test, power bled away to 502 watts 15 seconds in to the test.
In the second, power dipped to 542 watts at this point, 8% higher, then leveled to a gradual decline to hit 502 watts at 25 seconds.
A full ten seconds later.
So in all that time this rider would have been pulling away from themselves in their virtual sprint and would now be a few bike lengths ahead of their virtual presence!
The first test shows a peak, a steady decline then a drop off. The second test shows a later higher peak, a small dip, a gradual decline then a drop off.
However, the second drop off falls at a significantly lower rate and finishes at a higher power output than the first. In the first test we had a final power reading of 365 watts, in the second we have an 18% improvement to give a final reading of 432 watts.
You'll also notice that the increased power has come with a reduction in cadence; which means a bigger gear was being used to produce that power.
A little more work to get leg speed back to the cadence of the first test will see even bigger improvements and more power gains.
| Scores on the doors | ||||
| 1st test | 2nd test | Gain | ||
| ▼ Power drop of | 207 w | 163 w | +27% | |
| ▼ Absolute peak power of | 572 w | 595 w | +4% | |
| ▼ Relative peak power of | 7.94 w/kg | 8.50 w/kg | +7% | |
| ▼ Final power figure of | 365 w | 432 w | +18% | |
| ▼ Anaerobic fatigue index of | 36% | 24% | +33% | |
| ▼ Anaerobic capacity of | 224 w | 236 w | +5% |
What does it mean?
Obviously the results above can at worst be
described by an extreme cynic as "not bad". In fact they're bloody marvellous.
This rider always had the engine to be a sprinter they just didn't use it because they only sprinted (badly) once every other week in an actual race. And because they didn't see themselves as a sprinter they never committed to sprint training.
It's a self fulfilling prophecy; as with most things in life. Who dares wins; or in cycling terms, "Who sprints wins".
We can see the muscles, the physiological and the psychological systems have all come together to produce big gains. When most sprints are won by less than a wheel length these differences can be seen to be "event changing".
The power drop improvement means this rider can now go from further out and sustain their speed for longer. As others die 25 metres from the line, they may still slow but at less of a pace and maybe just enough to hold people off.
The absolute peak power shows a 4% increase, which is good but it was hit five seconds later which is fantastic. A double whammy.
The relative peak power shows a 7%.increase because during the month the rider lost a kilo in weight and a reduction in body fat. Again two wins for the price of one.
The final power improvement of 18% shows that this was an across the board improvement. It wasn't just a case of working on peak power. There are many facets to a sprint and they all need attention. Just going out and practicing sprinting isn't where it's at.
The anaerobic fatigue index gives the percentage of power decline over 30 seconds. The lower the better. As you can see we dropped a considerable amount in this area and improved overall by 33%.
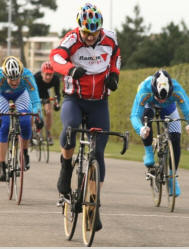 Our anaerobic capacity, the
indicator of total work accomplished within the 30 seconds, was up 5%.
This is the true indicator of our improvement as it takes in to account
all of our effort for all of the duration.
Now this may seem a small figure compared to the others but when you look at the tiny distances by which sprints are won and lost, an extra 5% is a phenomenal amount of return for eight sessions of work.
As a final note, the improvement isn't to be measured from the peaks and troughs of the lines. The real world improvement is the volume of the area sandwiched between the two green lines.
Every pedal rev builds on the increase of those that have gone before them. The improvement is cumulative throughout the entire duration of the sprint. And few sprints last 30 seconds. So after this test, a sprint is a doddle!
The Message
As you can see it doesn't matter which way you measure it, there have
been significant, quantifiable improvements. This comes from
focussing on an identified weakness and training specifically to address
it.
Knowing you have a sprint also helps when the going gets tough in the race itself. You'll feel more inclined to hurt for that extra second or two on the climb if you know you can out sprint the riders you're trying to hang on to. At our level we can all be a sprinter.
The power is within us we just need to unleash it.
Final Note
Power output is not as high in these tests as on the
road due to the fact the bike is locked in to an ergometer so the upper
body road action is negated.
I know the person who took the test can knock out over 800 watts on the road. So don't get hooked up on the numbers it's the percentage gains that matter. Although ergo-based, they are transferable to road riding.
This test isn't to determine maximal power, it determines sustainable power. However, the test conditions are repeatable and provide an excellent indicator to your capacity to sprint, jump or attack on a climb.
For a full explanation of the energy systems tested click the Anaerobic Capacity link on the left. To view a test protocol, click here.

